What to Improve
Identify bottlenecks and derive data-informed actions
1. Goal - Identifying bottlenecks that improve your North Star Metric
What You've Already Built
In the How we Report lesson, you created actionable dashboards: your North Star Metric dashboard, Input dashboards for traffic sources, Process dashboards for conversion, and Output dashboards for business health. Now you have data flowing in, dashboards showing insights, and a clear picture of how everything connects to your North Star Metric. But data alone doesn't improve your business–you need to identify what to improve and prioritize your efforts.
What You're Deciding Here
This lesson helps you make a critical strategic decision: What bottlenecks should you fix to improve your North Star Metric? Not everything can be improved at once. Some improvements drive massive impact on your North Star. Others are nice-to-have but don't move the needle. The goal is to focus on bottlenecks–the constraints that limit your North Star Metric–and ensure your North Star Metric is the right one for your business.
Your North Star Metric: The Foundation
You already have a North Star Metric (from your Metrics document). This lesson helps you:
- Validate your North Star Metric: Is it the right one? Does it truly represent success?
- Refine your North Star Metric: Make sure it's leading, actionable, aligned, and measurable
- Identify bottlenecks: Find what's limiting your North Star Metric
- Prioritize improvements: Focus on bottlenecks that will move your North Star Metric
Bottlenecks: What's Blocking Your North Star Metric?
A bottleneck is the narrowest point in your funnel–where the most leads drop off or get stuck. Fixing bottlenecks that affect your North Star Metric has the biggest impact because they're limiting your entire system. If your North Star Metric is MRR and you have 1,000 visitors but only 10 become customers, the bottleneck is conversion–not traffic.
What Should You Focus On First?
Your starting point depends on your North Star Metric and funnel performance:
If Your North Star Metric Isn't Moving
Focus on bottleneck analysis–find where leads drop off and fix those stages first. Look at your dashboards to see which leading indicators are weak. Low conversion usually means problems in MoFu (consideration) or BoFu (conversion), not ToFu (awareness).
If You're Not Sure Your North Star Metric Is Right
Start by validating your North Star Metric–is it truly leading, actionable, aligned, and measurable? Does it connect to your business goals? Refine it if needed, then align all improvements toward moving that number.
If Everything Needs Improvement
Focus on quick wins first–improvements that are easy to implement and drive immediate impact on your North Star Metric. Then tackle bigger bottlenecks. Don't try to fix everything at once.
Your Decision
By the end of this lesson, you'll have validated and refined your North Star Metric, identified key bottlenecks that limit it, and prioritized improvement opportunities that will drive the biggest impact on your North Star Metric.
2. Refining Your North Star Metric - Making sure it's the right one
Your North Star Metric is your foundation–it guides all your decisions and improvements. But is it the right one? This section helps you validate and refine your North Star Metric to ensure it truly represents success.
What Makes a Great North Star Metric
A great North Star Metric should be:
Leading: Moves before revenue (predicts future success)
Your North Star Metric should be a leading indicator, not a lagging one. If it moves after revenue, you're measuring the past, not predicting the future. For example, if revenue is your North Star, you're always looking backward. Instead, focus on what predicts revenue: active users, engagement, product adoption.
Actionable: You can influence it with your activities
Your North Star Metric should be something you can move through your actions. If you can't influence it, it's not useful for prioritizing improvements. For example, "market size" isn't actionable–you can't change it. But "active users" is actionable–you can improve onboarding, engagement, retention.
Aligned: Connects directly to your business goals
Your North Star Metric should align with what you're trying to achieve. If your goal is sustainable growth, your North Star shouldn't be "traffic" (too leading) or "profit" (too lagging). It should be something in between that represents sustainable growth: customer lifetime value, retention rate, or product-market fit score.
Measurable: You can track it consistently
Your North Star Metric should be something you can measure reliably. If you can't track it consistently, you can't optimize for it. Make sure you have the data and tracking in place to measure your North Star Metric weekly or monthly.
Focused: One clear number, not multiple metrics
Your North Star Metric should be ONE number, not multiple metrics. If you have multiple North Stars, you don't have a North Star. Pick the one that matters most right now. You can change it later as your business evolves.
Common North Star Metrics by Business Type
SaaS: Monthly Recurring Revenue (MRR), Active Users, Product-Market Fit Score
E-commerce: Customer Lifetime Value (LTV), Repeat Purchase Rate, Average Order Value
Content/Media: Engaged Users, Content Consumption, Subscriber Growth
Marketplace: Marketplace GMV, Supply-Demand Balance, Transaction Frequency
B2B Services: Customer Lifetime Value, Net Revenue Retention, Customer Health Score
Validating Your Current North Star Metric
Use these questions to validate your North Star Metric:
- Is it leading? Does it move before revenue? Can you see it changing before business results?
- Is it actionable? Can you influence it with your activities? Do you have control over it?
- Is it aligned? Does it connect to your primary business goal? Does success in this metric mean business success?
- Is it measurable? Can you track it consistently? Do you have the data?
- Is it focused? Is it ONE clear number? Not multiple metrics?
Refining Your North Star Metric
If your North Star Metric doesn't meet all these criteria, refine it:
- Too lagging? Move it earlier in the funnel (e.g., from "revenue" to "active users")
- Not actionable? Find a metric you can influence (e.g., from "market size" to "market share")
- Not aligned? Connect it to your business goals (e.g., from "traffic" to "engaged users")
- Not measurable? Set up tracking or choose a metric you can measure
- Not focused? Pick the ONE metric that matters most right now
Best Practices
- Start with your current North Star: Don't throw it away–validate and refine it
- Test it: Track it for a few weeks and see if it predicts success
- Be flexible: Your North Star Metric can evolve as your business grows
- Keep it simple: One number, easy to understand, easy to track
Outcome: You have a validated and refined North Star Metric that truly represents success for your business.
3. Finding Bottlenecks That Limit Your North Star Metric
Now that you have a validated North Star Metric, it's time to find the bottlenecks that limit it. Bottlenecks are the constraints that prevent your North Star Metric from growing–fixing them has the biggest impact.
What Are Bottlenecks?
A bottleneck is the narrowest point in your funnel–where the most leads drop off or get stuck. Bottlenecks limit your entire system because they constrain the flow from one stage to the next. If your North Star Metric is MRR and you have 1,000 visitors but only 10 become customers, the bottleneck is conversion–not traffic.
Finding Bottlenecks Using Your Dashboards
Use your dashboards to find bottlenecks:
From Your Input Dashboard:
- Are traffic sources bringing quality leads? (low quality = bottleneck)
- Is cost per visitor too high? (high cost = bottleneck)
- Are leading indicators weak? (weak leading indicators = bottleneck)
From Your Process Dashboard:
- Where do leads drop off? (biggest drop-off = bottleneck)
- Are conversion rates low? (low conversion = bottleneck)
- Which stage has the lowest rate? (lowest rate = bottleneck)
From Your Output Dashboard:
- Are lagging indicators confirming problems? (weak lagging indicators = bottleneck)
- Is customer experience poor? (poor experience = bottleneck)
- Is profitability low? (low profitability = bottleneck)
From Your North Star Metric Dashboard:
- Is your North Star Metric moving? (not moving = bottleneck somewhere)
- Are leading indicators weak? (weak leading indicators = bottleneck)
- Are lagging indicators confirming problems? (weak lagging indicators = bottleneck)
Calculating Bottleneck Impact
To find bottlenecks, calculate conversion rates between each stage:
ToFu → MoFu: How many visitors become engaged leads?
MoFu → BoFu: How many engaged leads become qualified opportunities?
BoFu → GroFu: How many customers become repeat/advocate customers?
The stage with the lowest conversion rate is usually your bottleneck. Fix that first–it has the biggest impact because it's limiting your entire system.
Example Bottleneck Analysis:
North Star Metric: Monthly Recurring Revenue (MRR)

1,000 visitors (ToFu)
  ↓ 10% conversion
100 leads (MoFu)
  ↓ 5% conversion  ← BOTTLENECK (lowest rate, limits MRR)
5 customers (BoFu)
  ↓ 80% retention
4 repeat customers (GroFu)

Bottleneck: MoFu → BoFu conversion (only 5%)
Impact: Fixing this from 5% to 10% doubles customers (5 → 10)
Impact on North Star: Doubles MRR (if each customer pays $100/month, MRR goes from $500 to $1,000)
Priority: Focus on MoFu engagement and BoFu conversion
Connecting Bottlenecks to Your North Star Metric
Not all bottlenecks affect your North Star Metric equally. Focus on bottlenecks that:
- Directly limit your North Star Metric: If your North Star is MRR, bottlenecks in conversion directly limit it
- Have the biggest impact: Fixing a 5% → 10% conversion rate doubles your North Star Metric
- Are actionable: You can fix them with your current resources and activities
Prioritizing Bottlenecks
Prioritize bottlenecks by:
- Impact on North Star Metric: How much will fixing this improve your North Star?
- Ease of fixing: How easy is it to fix? (quick wins vs. big projects)
- Resources needed: What resources do you need? (time, money, team)
- Dependencies: What needs to happen first?
Best Practices
- Start with your North Star Metric: What's limiting it?
- Use your dashboards: They show where bottlenecks are
- Focus on impact: Fix bottlenecks that have the biggest impact on your North Star
- Prioritize: Don't try to fix everything at once–focus on the biggest bottlenecks first
Outcome: You have identified the bottlenecks that limit your North Star Metric and prioritized them by impact.
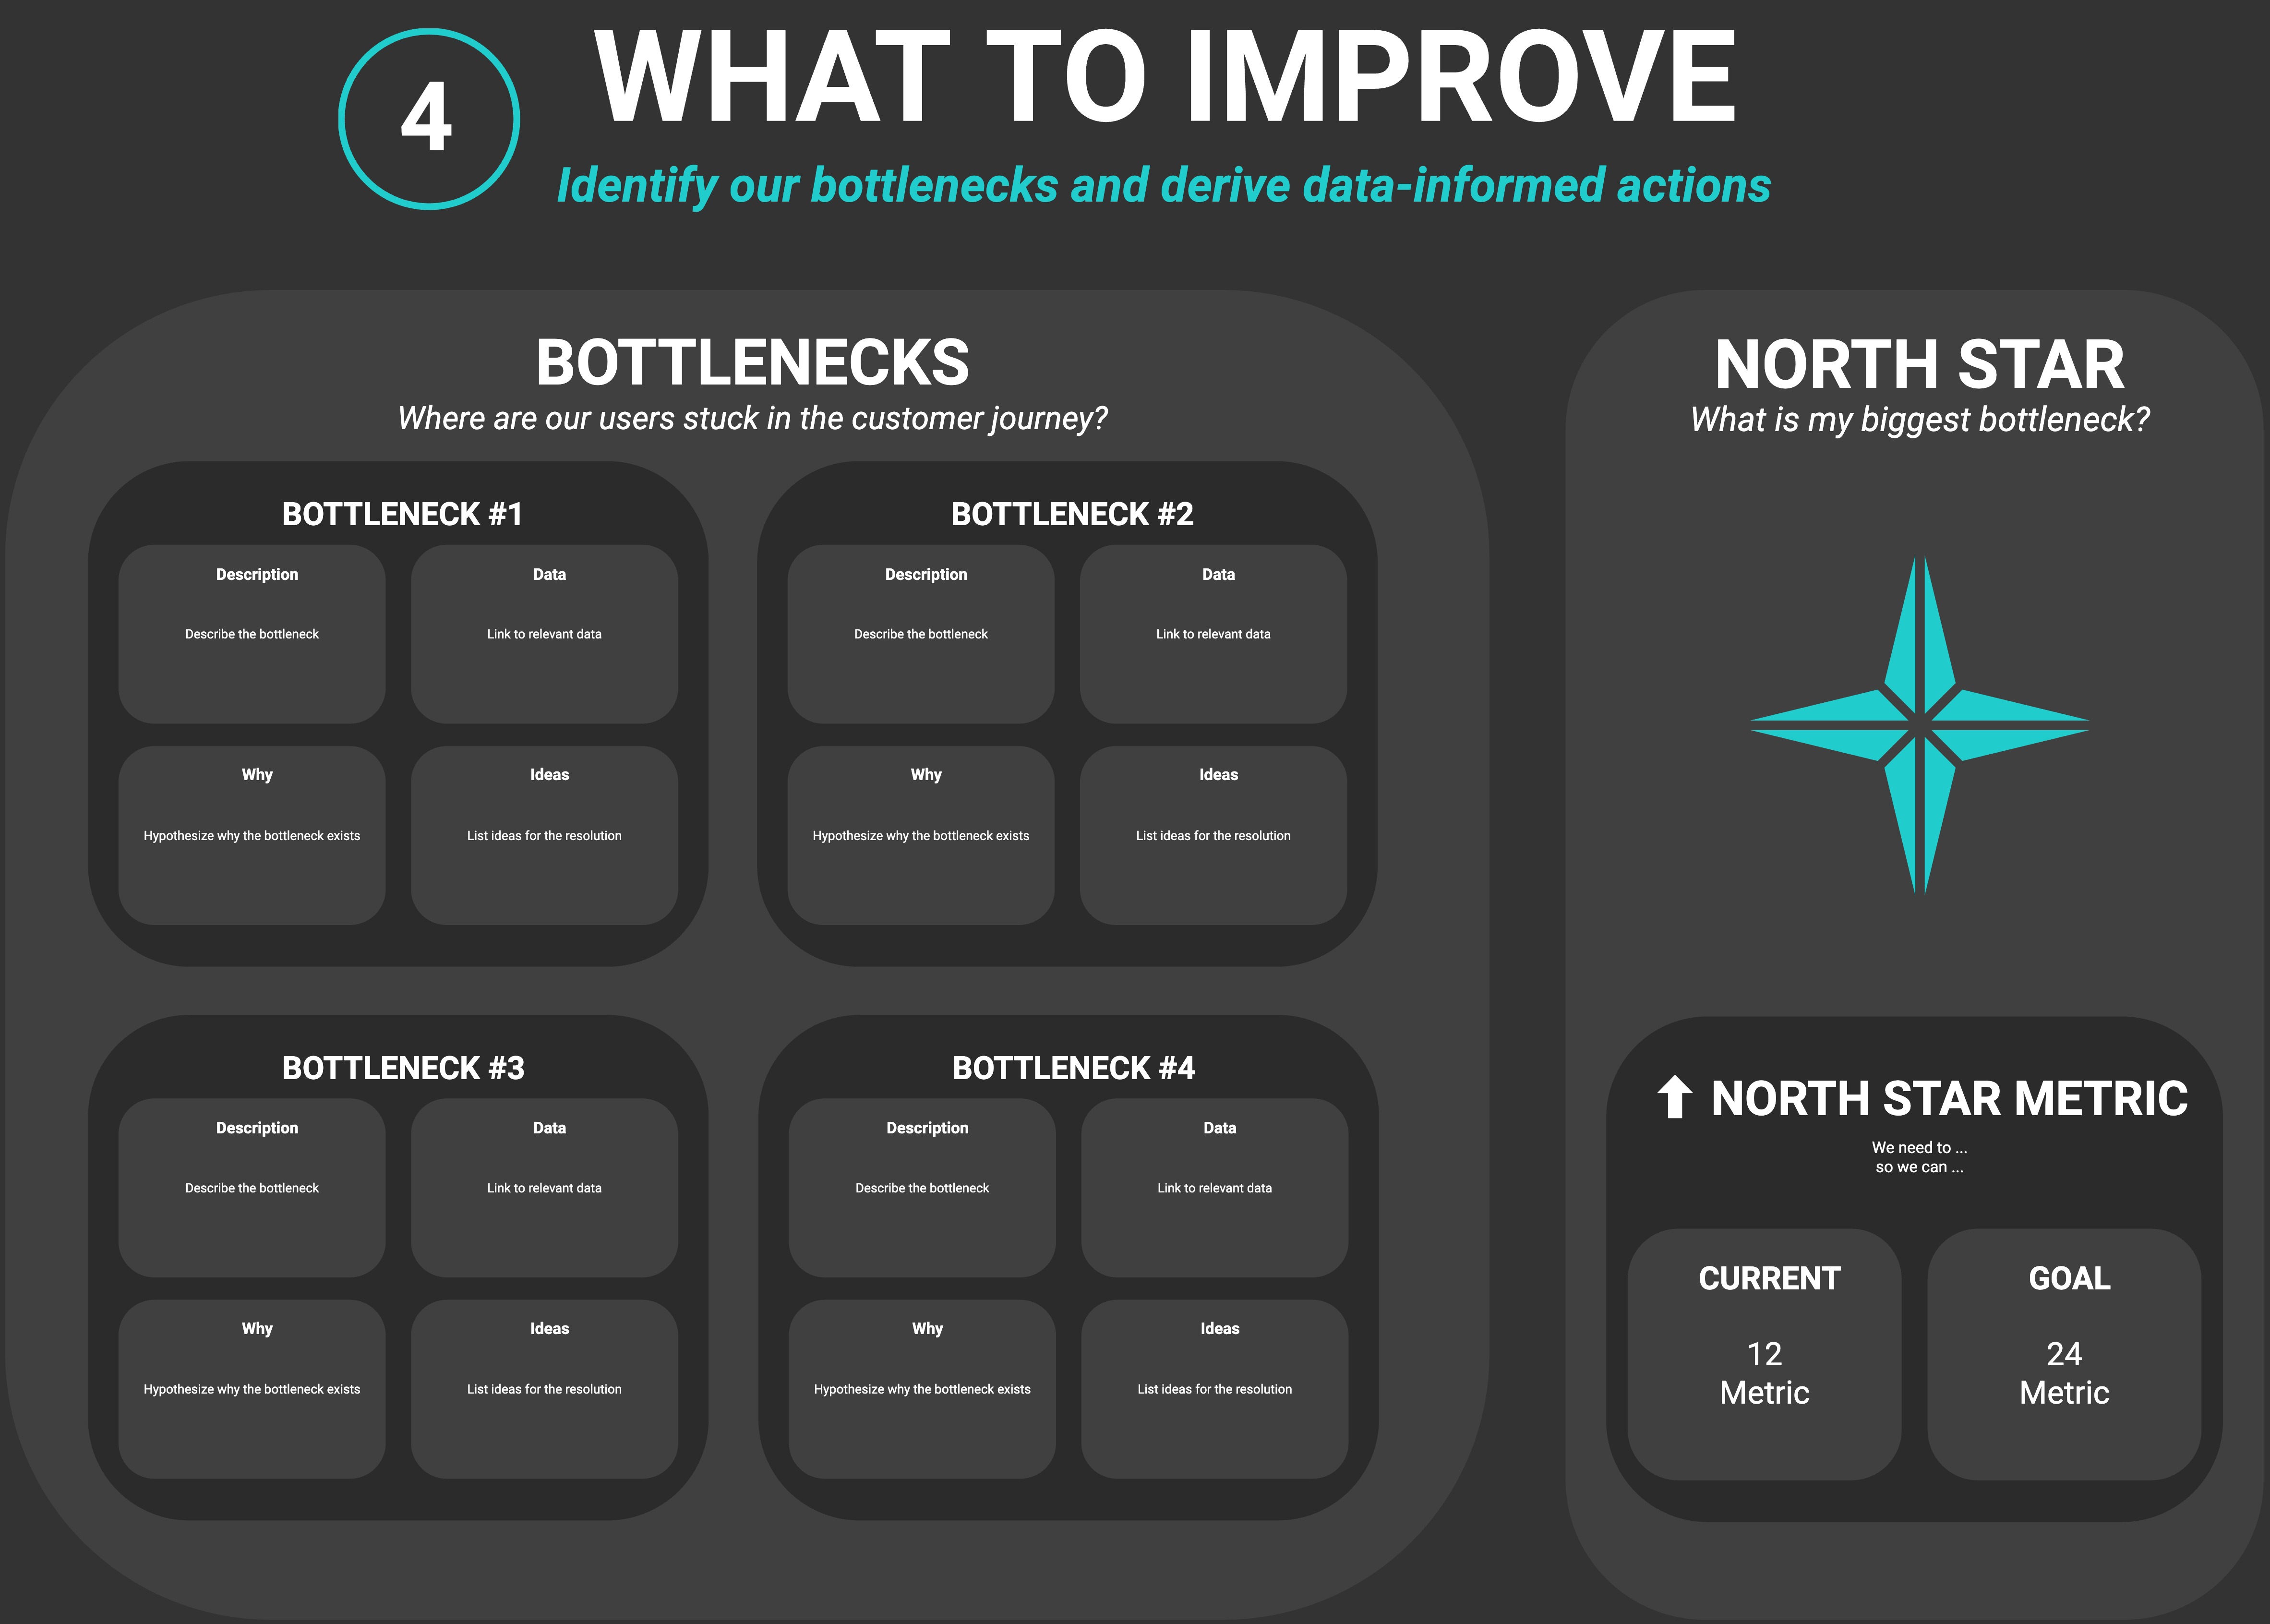
4. Your North Star Document
Creating Your North Star Document
Throughout this lesson, you've validated and refined your North Star Metric, identified bottlenecks that limit it, and prioritized improvements. Now it's time to create a single document that consolidates everything: your North Star Metric definition, how it connects to your funnel, leading/lagging indicators, bottlenecks that limit it, and prioritized improvements.
The Goal: Complete North Star Document
This North Star document will serve as your reference for:
- Your North Star Metric definition and why it matters
- How it connects to your funnel stages and other metrics
- Leading and lagging indicators
- Bottlenecks that limit your North Star Metric
- Prioritized improvements to move your North Star Metric
Outcome: You have a complete North Star document that defines your North Star Metric, shows how it connects to your funnel, identifies bottlenecks that limit it, and prioritizes improvements to move it.