Summary
Working with your data analytics strategy
1. From Guesswork to Data-Driven Decisions
You started this level with assumptions and intuition. You end it with a complete data analytics system: defined metrics, tracking systems, actionable dashboards, and a clear North Star Metric that guides all your decisions.
The Transformation
-
Before: "I think my content is working"
After: "My content generated 47 leads last month, 12 converted, and 3 became customers–here's what to optimize based on my North Star Metric." -
Before: Tracking nothing or tracking everything
After: Tracking the right metrics that drive decisions at each funnel stage, all connected to your North Star Metric. -
Before: Data scattered across tools and spreadsheets
After: Consolidated metrics overview, tracking setup overview, dashboard overview, and North Star document–all working together. -
Before: Not sure what to improve
After: Clear bottlenecks identified, North Star Metric validated and refined, prioritized improvements that directly impact your North Star.
The Foundation You Built
Throughout this level, you've created four essential documents that form your complete data analytics system:
- [Business Name] - Metrics.md: Complete list of metrics for each funnel stage (ToFu, MoFu, BoFu, GroFu) and your North Star Metric definition
- [Business Name] - Tracking Setup.md: How to capture data (spreadsheets, automated tools, CRM events, product database tracking)
- [Business Name] - Dashboards.md: Your North Star Metric dashboard, Input dashboards, Process dashboards, and Output dashboards–and how they all connect
- [Business Name] - North Star.md: Your validated North Star Metric, leading/lagging indicators, bottlenecks that limit it, and prioritized improvements
These documents work together to create a complete analytics system that supports data-driven decision-making, all centered around your North Star Metric.
2. The Complete Analytics System
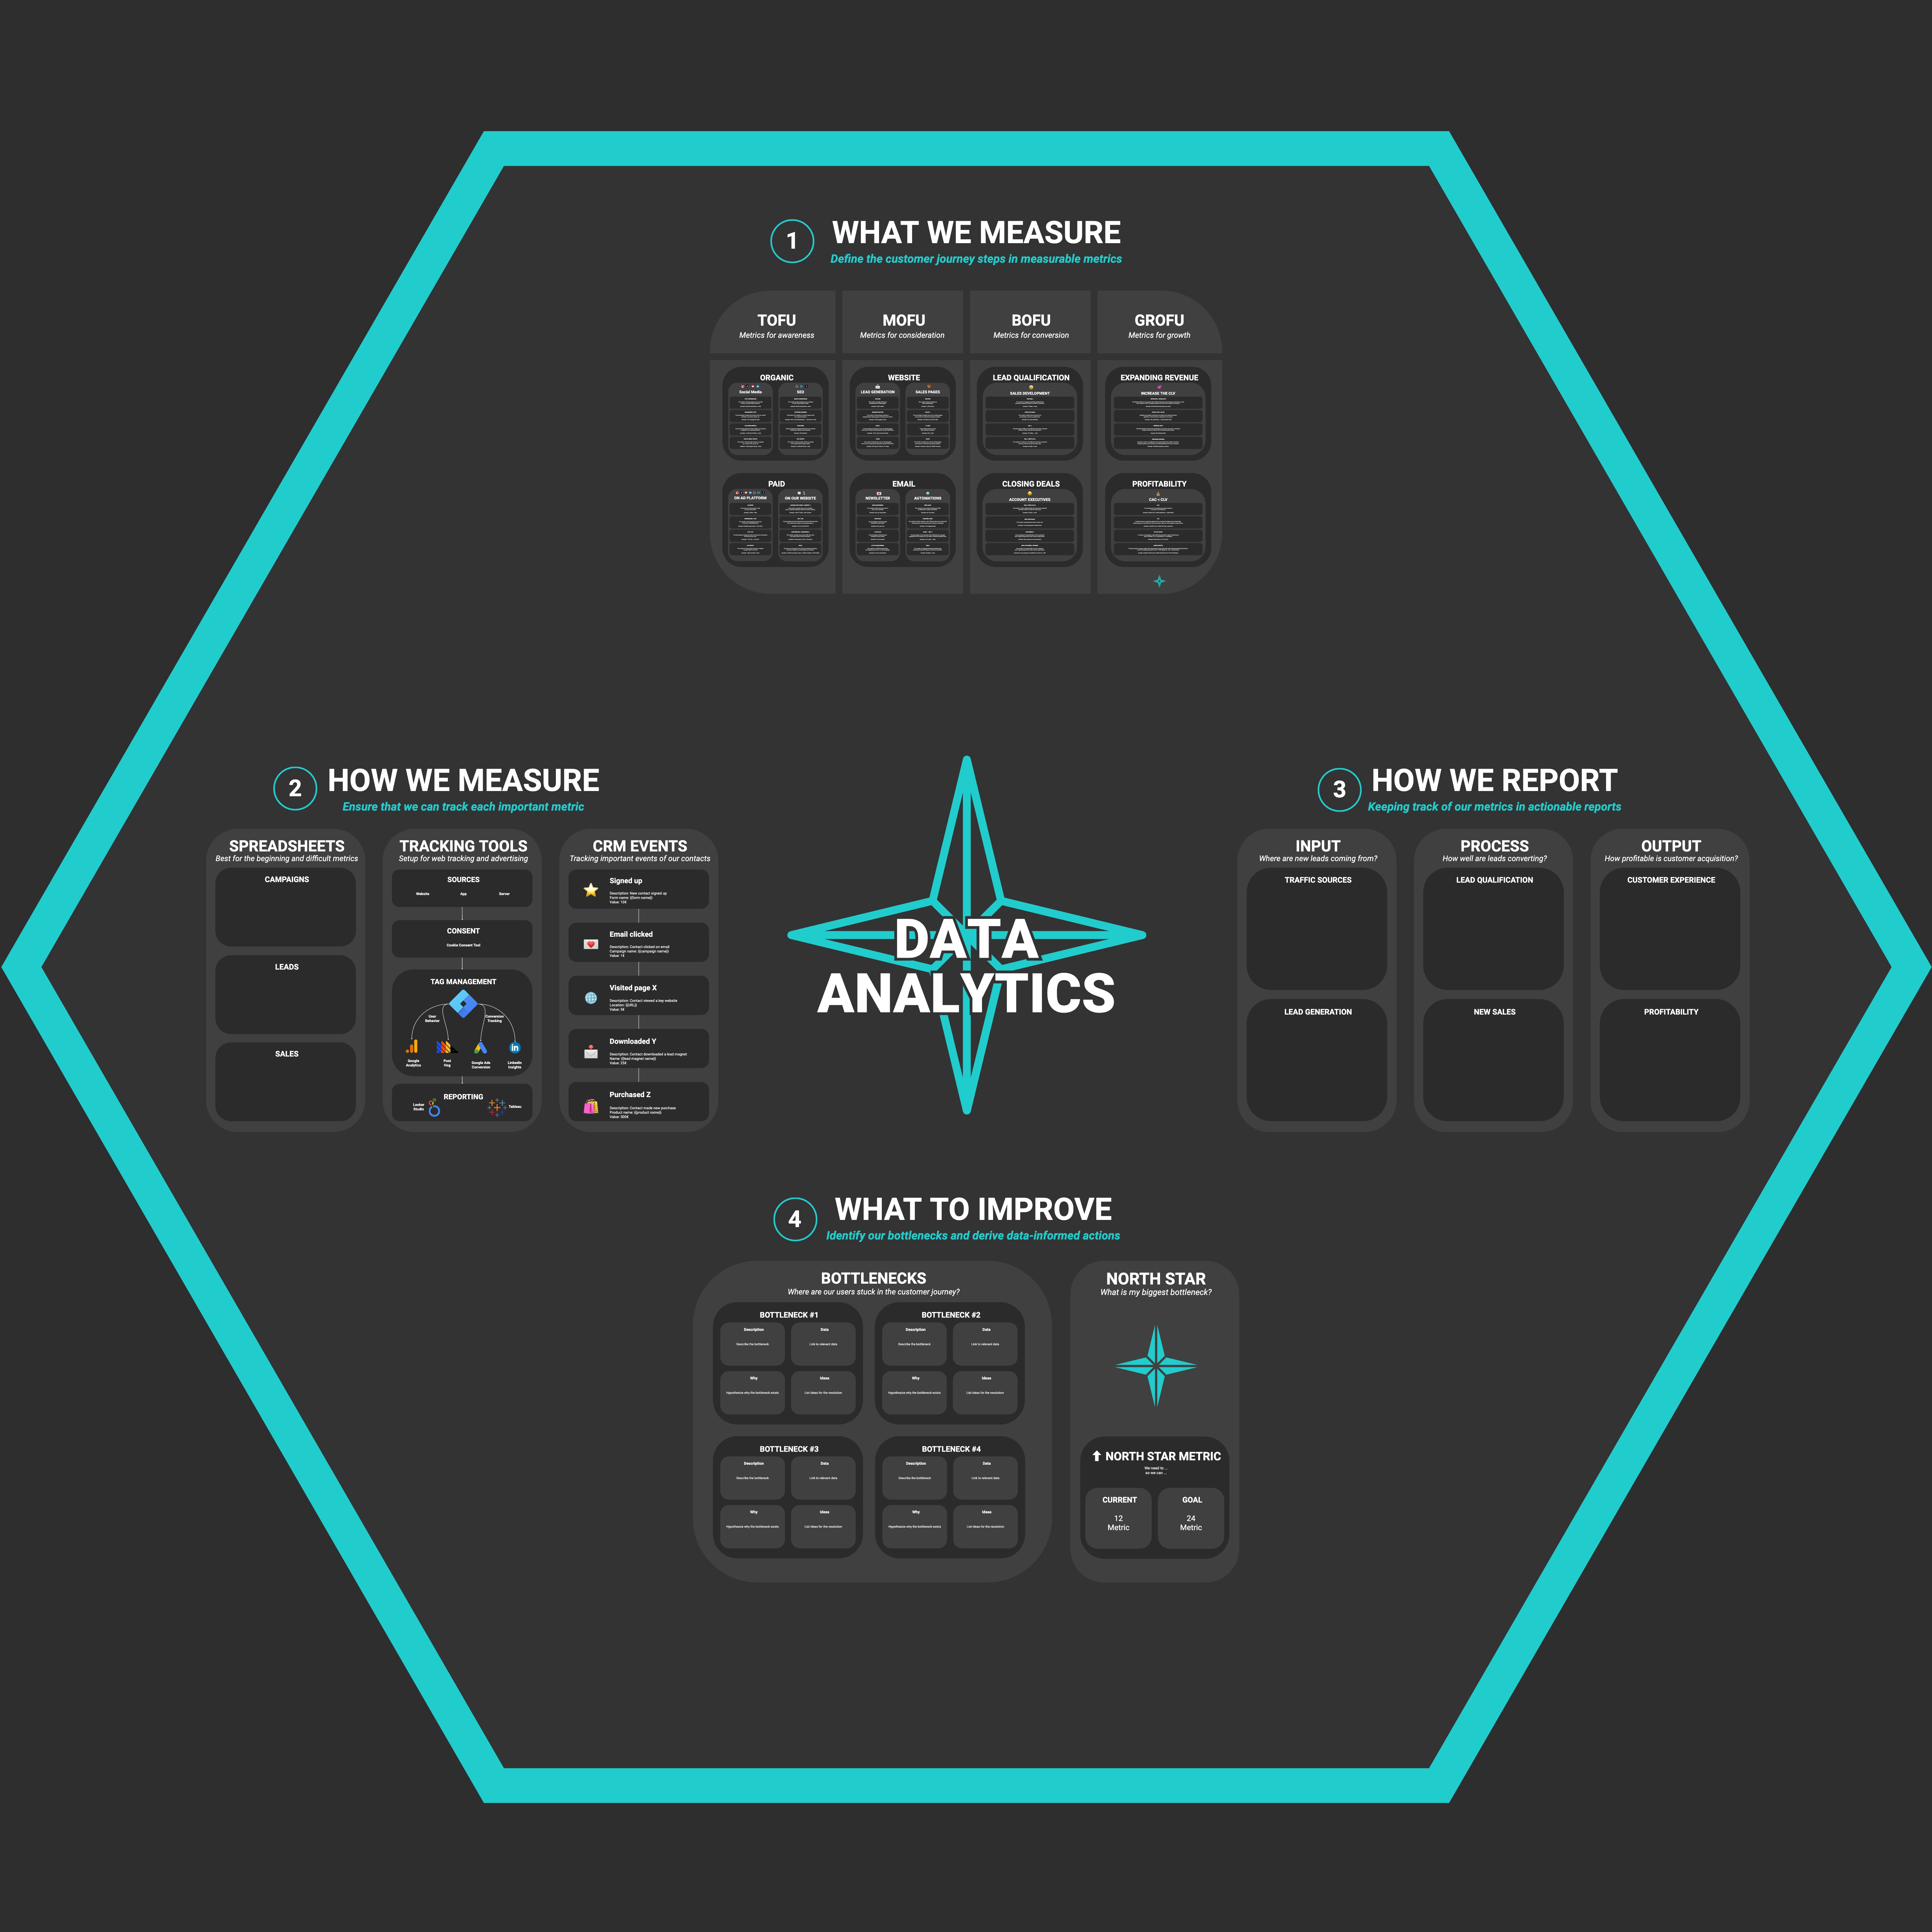
Your data analytics system has four components that work together, all centered around your North Star Metric:
What we Measure → Define the metrics that matter
In Lesson 2, you defined metrics for each funnel stage (ToFu, MoFu, BoFu, GroFu) and identified your North Star Metric–the one number that represents success. Your Metrics document captures all these metrics and shows how they connect to your North Star.
How we Measure → Set up systems to capture data
In Lesson 3, you set up tracking systems: spreadsheets for manual tracking, automated tools for website/ad data, CRM events for customer journey tracking, and product database tracking for user behavior. Your Tracking Setup document shows how all these systems work together to capture the data you need.
How we Report → Turn data into actionable dashboards
In Lesson 4, you created four types of dashboards: your North Star Metric dashboard (the foundation), Input dashboards for traffic sources and cost, Process dashboards for conversion, and Output dashboards for business health. Your Dashboards document shows how all dashboards connect to your North Star Metric through leading and lagging indicators.
What to Improve → Focus on bottlenecks that move your North Star Metric
In Lesson 5, you validated and refined your North Star Metric, identified bottlenecks that limit it, and prioritized improvements that will have the biggest impact. Your North Star document consolidates everything: your North Star definition, leading/lagging indicators, bottlenecks, and prioritized improvements.
How They Work Together
Each component builds on the previous one:
- Metrics define what to track (including your North Star Metric)
- Tracking captures the data for those metrics
- Dashboards visualize the data and show how everything connects to your North Star
- Improvements focus on bottlenecks that move your North Star Metric
The North Star Metric: Your Foundation
Your North Star Metric is the center of everything:
- All metrics connect to it (leading indicators predict it, lagging indicators confirm it)
- All dashboards track it (North Star dashboard shows it, other dashboards show leading/lagging indicators)
- All improvements target it (bottlenecks that limit it, improvements that move it)
The Continuous Cycle
Analytics isn't a one-time setup–it's an ongoing practice:
- Measure your metrics regularly (weekly/monthly), focusing on your North Star Metric
- Track using your dashboards to see how leading/lagging indicators connect to your North Star
- Identify bottlenecks that limit your North Star Metric
- Improve based on prioritized improvements that move your North Star
- Repeat the cycle to continuously optimize
This cycle ensures you're always improving, always optimizing, always moving your North Star Metric forward.
3. What You've Accomplished
Lesson 1: Overview
You learned what data analytics is and why it matters. You understood the four components: What we Measure, How we Measure, How we Report, and What to Improve.
Lesson 2: What we Measure
You defined metrics for each funnel stage (ToFu, MoFu, BoFu, GroFu) and identified your North Star Metric. You created your [Business Name] - Metrics.md document that captures all your metrics and shows how they connect to your North Star.
Lesson 3: How we Measure
You set up tracking systems: spreadsheets for manual tracking, automated tools for website/ad data, CRM events for customer journey tracking, and product database tracking for user behavior. You created your [Business Name] - Tracking Setup.md document that shows how all tracking systems work together.
Lesson 4: How we Report
You created four types of dashboards: your North Star Metric dashboard (showing your North Star and leading/lagging indicators), Input dashboards (traffic sources and cost), Process dashboards (conversion), and Output dashboards (business health). You created your [Business Name] - Dashboards.md document that shows how all dashboards connect to your North Star Metric.
Lesson 5: What to Improve
You validated and refined your North Star Metric, identified bottlenecks that limit it, and prioritized improvements that will have the biggest impact. You created your [Business Name] - North Star.md document that consolidates your North Star definition, leading/lagging indicators, bottlenecks, and prioritized improvements.
The Complete System
Together, these four documents create a complete data analytics system:
- Metrics tells you what to track
- Tracking Setup tells you how to capture data
- Dashboards tells you how to visualize and interpret data
- North Star tells you what to improve and why
All centered around your North Star Metric–the one number that represents success.
4. Best Practices for Maintaining Your Analytics System
Keep It Simple
Start with 5-7 key metrics plus your North Star Metric. Add more as you need them. Don't track everything–track what matters and connects to your North Star.
Update Regularly
Review your North Star Metric dashboard daily or weekly. Review other dashboards weekly, analyze monthly. Don't let data get stale. Regular updates catch problems early and reveal opportunities quickly.
Focus on Your North Star Metric
Everything should connect to your North Star Metric. If a metric doesn't connect to your North Star, question why you're tracking it. If a dashboard doesn't show leading/lagging indicators for your North Star, refine it. If an improvement doesn't move your North Star, deprioritize it.
Use Leading and Lagging Indicators
Leading indicators predict your North Star Metric–watch them to see if you're on track. Lagging indicators confirm your North Star Metric–use them to validate that improvements are working. Your dashboards should show both.
Prioritize Bottlenecks
Focus on bottlenecks that directly limit your North Star Metric. Fix the biggest bottlenecks first–they have the biggest impact. Don't try to fix everything at once.
Iterate and Improve
Your analytics system will evolve. As you learn what matters, adjust your metrics, tracking, and dashboards. Your North Star Metric might evolve too–that's okay. The system should serve you, not the other way around.
Share with Your Team
If you have a team, make sure everyone sees the same data. Share your North Star Metric dashboard–everyone should know what success looks like. Shared dashboards ensure everyone is aligned and working toward the same goal.
5. Your Complete Data Analytics Master Document
Creating Your Master Data Analytics Document
Throughout this level, you've created four essential documents that form your complete data analytics system. Now it's time to consolidate everything into a single master document that you can reference in the future–a document that contains all the important information an AI assistant might need to help you with your data analytics strategy.
The Goal: Single Master Document for All Data Analytics Knowledge
This master document will serve as your complete reference for:
- Your complete data analytics system
- All metrics, tracking systems, dashboards, and improvements
- How everything connects to your North Star Metric
- Future AI assistants understanding your analytics setup
Having all your analytics knowledge in one place means you can quickly reference your system, onboard new team members, and ensure AI assistants have complete context when helping you optimize your analytics.
Outcome: You have a complete Data Analytics master document that consolidates all your analytics knowledge into one reference document for future use.