Data Analytics
Measure the progress towards your goals
1. What is Data Analytics
Data analytics is the practice of measuring, tracking, and understanding how your marketing efforts and user behavior translate into real business results. It's about moving from "I think this is working" to "I know this is working because the data shows it." Without analytics, you're flying blind–you can't improve what you don't measure.
In this level, you'll build a complete data analytics system that tracks your customer journey from first touchpoint to loyal customer, and monitors how users behave in your product. You'll learn to measure what matters–both in your marketing funnel and in your product–set up tracking systems, create actionable reports, and identify opportunities for improvement–all so you can make data-driven decisions that accelerate your growth.
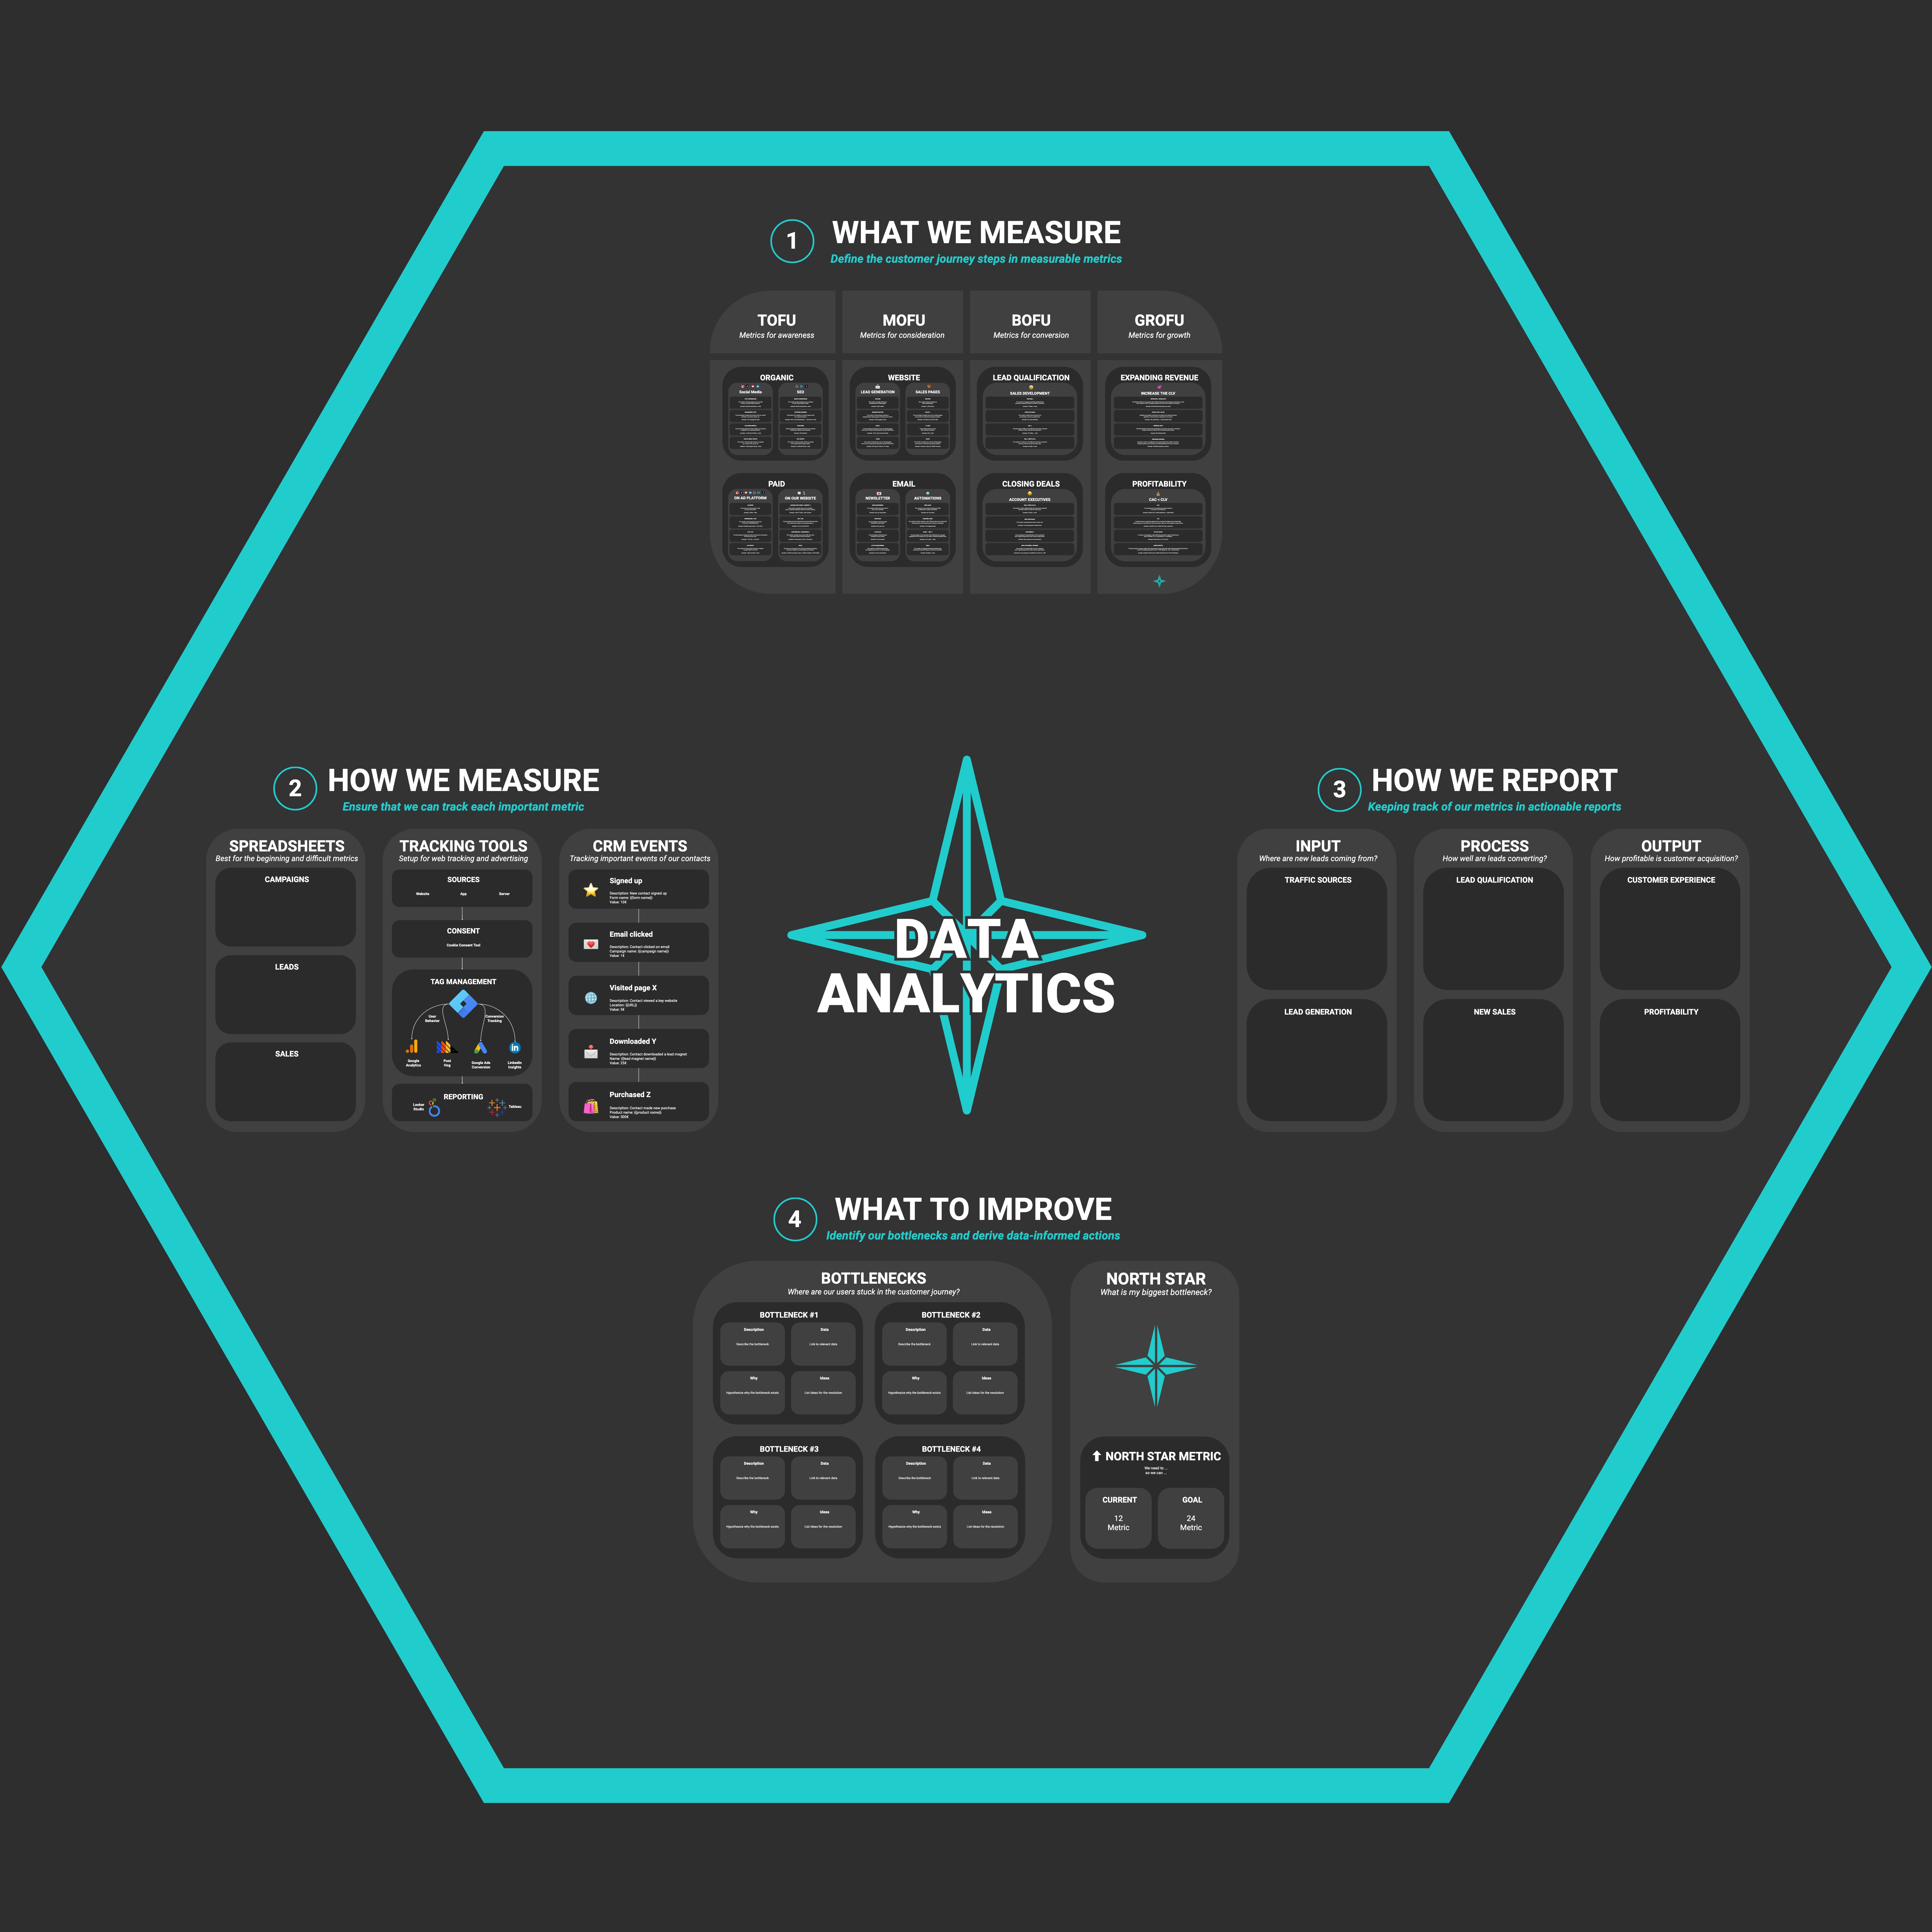
Throughout this level, you'll master four essential components:
- What we Measure: Define measurable metrics for each stage of your customer journey
- How we Measure: Set up tracking systems to capture the data you need
- How we Report: Create actionable reports that drive decision-making
- What to Improve: Identify bottlenecks and opportunities using your data
2. The Four Steps of Data Analytics
This Data Analytics level is structured into four core steps:
Step 1: What we Measure
Define the metrics that matter for your business at each stage of the customer journey. You'll learn to track awareness metrics (ToFu), consideration metrics (MoFu), conversion metrics (BoFu), and growth metrics (GroFu)–creating a complete picture of how people move through your funnel.
Step 2: How we Measure
Tracking systems are the tools and processes you use to capture data about your marketing activities and customer behavior. This includes spreadsheets for manual tracking, automated tools like Google Analytics for web tracking, and CRM events for tracking customer interactions.
You'll set up the right tracking approach for your business, whether that's simple spreadsheets for getting started, automated tools for scale, or CRM integration for comprehensive customer journey tracking.
Step 3: How we Report
Reports transform raw data into actionable insights. Using the Input, Process, Output (IPO) framework, you'll create reports that show what's happening, why it matters, and what actions to take. Good reporting turns data into decisions.
Step 4: What to Improve
Improvement analysis uses your data to identify bottlenecks, opportunities, and priorities. You'll learn to find what's blocking growth, define your North Star Metric, and focus your efforts on changes that drive the biggest impact.
3. Why Data Analytics Matters
Data analytics transforms guesswork into strategy. It's the difference between "I think my content is working" and "My content generated 47 leads last month, 12 converted, and 3 became customers–here's what to optimize."
The Foundation: Funnel Building
Your funnel building work comes first–creating the systems that generate leads and convert customers. But without analytics, you can't see what's working, what's broken, or where to focus your efforts. Analytics is how you optimize and scale what you've built.
From Intuition to Insight
Before analytics, you rely on intuition and assumptions. After analytics, you have:
- Clear visibility into what's working and what isn't (in both marketing and product)
- Data-driven decisions instead of gut feelings
- Ability to identify bottlenecks before they become problems
- Understanding of how users actually use your product (not just how you think they do)
- Confidence in where to invest time and resources
Continuous Improvement
Analytics isn't a one-time setup–it's an ongoing practice. Regular reporting helps you:
- Catch problems early before they impact revenue
- Double down on what's working
- Test improvements with measurable results
- Scale successful strategies with confidence
The System in Action
Here's how it works in practice:
- Define Metrics → Know what to track at each funnel stage and in your product
- Set Up Tracking → Capture marketing data and user behavior data automatically or manually
- Create Reports → Transform data into actionable insights
- Identify Improvements → Focus on changes that drive growth (in marketing and product)
4. Setting Up Your Claude Chat
We're building on top of the strategy project you already set up (it should have "strategy" in the project name). We recommend Claude (claude.ai or the Claude desktop app), but you can use another AI chat that supports projects. If you haven't set that up yet, check out the Growth Roadmap overview to get started.
Step-by-Step Setup Guide
-
Open Claude and navigate to your existing strategy project (it should have "strategy" in the project name).
-
Create a new chat:
- Start a new chat within your existing strategy project
- Make sure you're in the right project–this chat will build on the foundational context you already established
- This new conversation will focus specifically on Data Analytics work
-
Verify your project context:
- Your existing project already has your Strategy document (business context and growth goals), Story Framework document (audience, story, and content strategy), and Funnel Overview document (customer journey and funnel structure)
- This new chat will add data analytics context on top of that foundation
- All conversations in this project can reference your business context, story framework, funnel strategy, and now your analytics approach
Outcome: You have a new chat ready in your existing strategy project for Data Analytics work.
-
Copy and paste the AI prompt below into this new conversation. This prompt will gather information about your current analytics state and goals. We already have your business context, story framework, and funnel structure from previous work, so we'll focus specifically on your data analytics needs.
-
Answer Claude's questions as thoroughly as possible. The more context you provide, the better guidance you'll receive in subsequent lessons.
-
Save important information that Claude summarizes, as you may want to reference it later or share it with your team.
Why This Matters
Having data analytics context in your strategy project means:
- Claude understands your current tracking setup and can build on what exists
- Recommendations are tailored to your funnel structure and business model
- You don't have to repeat analytics information in every conversation
- The AI can connect insights across different stages of your customer journey
Outcome: You have documented foundational context that Claude can reference throughout your data analytics work.
Ready to Begin?
Once you've completed the Claude setup and gathered your foundational context, start with Step 1: What we Measure to define the metrics that matter for your customer journey. Each step builds on the previous one, so follow them in order for the best results.